
Experimental work in biology: Biology experiments to download
Beneath the description of each experiment you will find links from which you can open or download the experiments in Word format, and a link from which you can download the group of documents in a zip file. If you do not have Microsoft Word installed you can download Word Viewer free here. If you do not have WinZip installed you can download a free trial here. To download whole sets of experiments in zip files see the links to the right. |
Bulk Downloads
|
Food testsReagent for food tests and enzymesReagent for food tests and enzymes1 Test for starchUsing iodine solution1. Test for starch 2 Test for glucoseUsing Benedict’s reagent2. Test for glucose 3 Test for proteinThe biuret reaction3. Test for protein 4 Test for lipidThe emulsion test4. Test for fats 5 How sensitive is the starch test?A serial dilution of starch solution is tested with iodine
5.01 How sensitive is the iodine test? 6 Testing food for starchSamples of different foods are tested with iodine solution
6.01 Testing food for starch 7 A comparison of vitamin C contentThe volumes of fruit juices needed to decolourise DCPIP are measured
7.01 Comparison of vitamin C content EnzymesReagent for food tests and enzymesReagent for food tests and enzymes1 Effect of amylase on starchDisappearance of blue colour from starch solution plus iodine
1.01 Effect of amylase on starch 2 Effect of temperatureTiming the disappearance of the blue colour at different temperatures
2.01 Effect of temperature 3 Effect of pHTiming the disappearance of blue colour at different pH values
3.01 Effect of pH 4 CatalaseLiver and yeast are used to decompose hydrogen peroxide
4.01 Catalase 5 Effect of enzyme concentrationIncreasing strengths of urease are used to produce ammonia from urea
5.01 Effect of enzyme concentration 6 Enzymes in maize fruitsMaize fruits are sectioned and placed on starch-agar. Iodine solution reveals clear areas of starch-agar under the fruit
6.01 Starch-digesting enzymes in maize Respiration1 Oxygen uptakeThe inability of air from germinating seeds to support combustion
1.01 Oxygen uptake 2 Carbon dioxide outputThe gas from germinating seeds turns limewater milky
2.01 Carbon dioxide output 3 Exhaled air (1)The last fraction of exhaled air will not support combustion
3.01 Exhaled air (1) 4 Exhaled air (2)Atmospheric air and exhaled air are bubbled simultaneously through limewater
4.01 Exhaled air (2) 5 Respiration in living organismsA manometer reveals uptake of oxygen by germinating seeds
Introduction to experiments on respiration 6 Anaerobic respirationThe gas produced by a yeast suspension from which air is excluded turns limewater milky
6.01 Anaerobic respiration 7 Energy release during respirationGerminating wheat is packed into vacuum flasks to see if there is any rise in temperature over a few days
7.01 Energy release in respiration 8 Changes in mass during germinationWheat is germinated for about two weeks. Samples are taken at 2-day intervals, dried and weighed
8.01 Changes in mass during germination 9 Measuring the uptake of oxygenThe respirometer is used to measure the uptake of oxygen in living organisms
9.01 Measuring the uptake of oxygen 10 Temperature effect on respirationThe oxygen uptake of living organisms at different temperatures is measured with the respirometer
10.01 Temperature effect on respiration 11 Oxygen uptake in blowfly larvaeThe oxygen uptake of blowfly larvae is measured over a 20 minute period. The air in the respirometer is then renewed and the rate of oxygen uptake compared
11.01 Oxygen uptake in blowfly larvae 12 The effect of temperature on fermentation rateThe respirometer is used to measure the rate of carbon dioxide production from a suspension of yeast in glucose solution at different temperatures
12.01 Temperature and fermentation rate PhotosynthesisIntroduction to experiments on Photosynthesis1 Production of gas by pondweedBubbles escape from the cut stems of Canadian pondweed when illuminated
Introduction 2 Testing a leaf for starchThe technique of killing and decolourising a leaf and testing it with iodine solution
2.01 Testing a leaf for starch 3 The need for lightLight is excluded from part of a leaf which is tested for starch after a period of illumination
3.01 The need for light /Discussion 4 The need for chlorophyllA variegated leaf is tested for starch after a period of illumination
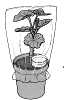
4.01 The need for chlorophyll/ Discussion 5 The need for carbon dioxideA potted plant is enclosed in a plastic bag from which carbon dioxide has been absorbed.one of its leaves is tested for starch after a period of illumination
5.01 The need for carbon dioxide 6 Collecting the gas from pondweedThe cut end of a Canadian pondweed shoot is placed in a water-filled test tube. The gas is collected and tested for oxygen
6.01 Collecting the gas from pondweed 7 Gaseous exchange in leavesLeaves are enclosed in test-tubes containing hydrogencarbonate indicator. The tubes are illuminated or darkened
7.01 Gaseous exchange in leaves 8 Gaseous exchange in pond-weedLeaves are enclosed in test-tubes containing hydrogencarbonate indicator. The tubes are illuminated or darkened
8.01 Gaseous exchange in pond-weed 9 The need for mineral elementsWheat seedlings are grown for two weeks in water cultures lacking essential elements
9.01 The need for mineral elements Diffusion1 Diffusion in gasesDiffusion of ammonia is observed in a glass tube using litmus paper
1.01 Diffusion in gases 2 Diffusion in liquidDiffusion of methylene blue through gelatine is observed
2.01 Diffusion in liquid 3 Diffusion and sizeDifferent size blocks of gelatine mixed with cresol red are immersed in acid to see the progress of the acid through the gelatine
3.01 Diffusion and size 4 Diffusion through a membraneA dialysis tube filled with starch solution is immersed in iodine solution
4.01 Diffusion through a membrane 5 Control of diffusionBeetroot discs are heated at increasing temperatures to illustrate the control on diffusion by the cell membrane
5.01 Control of diffusion 6 Two-way diffusionAmmonia diffuses into gelatine coloured with cresol red which diffuses in the opposite direction
6.01 Two-way diffusion in a liquid Osmosis1 OsmosisAn osmometer made from dialysis tubing and a capillary tube shows osmosis happening
1.01 Osmosis 2 Selective permeabilityDialysis tubing containing starch and glucose solutions is immersed in water
2.01 Selective permeability 3 TurgorA length of dialysis tube is partly filled with a syrup solution and immersed in water
3.01 Turgor 4 Turgor in plant tissueStrips of dandelion stalk are immersed in salt solutions of differing strength and changes in curvature observed
4.01 Turgor in a dandelion stalk 5 Turgor in potato tissueCylinders of potato tissue are immersed in solutions of differing strength and changes in length are measured
5.01 Turgor in potato tissue 6 Root pressureGlass tubes are fitted to the cut branches of a potted plant. The levels of liquid in each tube are observed
6.01 Root pressure 7 Stomatal movementsLeaf epidermis is irrigated with salt solution to see its effect on guard cells
7.01 Stomatal movements 8 PlasmolysisRed epidermis from rhubarb petiole is irrigated with sucrose solution and observed under the microscope
8.01 Plasmolysis 9 Surface area and osmosisPotato cubes with equal volume but different surface area are immersed in water and weighed
8.01 Surface area and osmosis |
Human senses1 Reaction timeThe distance a vertical ruler falls before being gripped is converted to a time interval
1.01 Reaction time 2a The blind spot (1)A dot seems to disappear when its image falls on the blind spot2b The blind spot (2)A gap in a line is 'filled in' when its image falls on the blind spot
2.01 The blind spot (a) & (b) 3 Inversion of the imageWhen a pin is viewed via a pinhole in front of the pin, its image appears to be inverted
3.01 Inversion of the image 4a The iris diaphragm (1)The iris is observed to reduce the size of the pupil when the eye is exposed to light4b The iris diaphragm (2)(Broca's pupillometer) A pattern of pinholes appears to change when one eye is exposed to light
4.01 Iris diaphragm (1) & (2) 5 Retinal capillariesBy moving a pinhole about in front of the eye, an image of retinal capillaries appears
5.01 Retinal capillaries 6a Binocular vision: eye dominanceA pencil lined up with a window frame appears to 'jump' when the dominant eye is closed6b Binocular vision: double visionSlight pressure on one eyeball causes a single object to appear as a double image
6.01 Binocular vision (a) and (b) 7 Judgement of distanceThe space sequence of coloured pinheads is judged using either one or both eyes
7.01 Judgement of distance 8 Eye and hand co-ordinationA star pattern is traced while looking in a mirror
8.01 Eye and hand co-ordination 9 PerceptionTwo shapes are observed, and demonstrate that the brain makes an interpretation of the image10 Sensitivity of the skin to touchDifferent areas of skin are tested with light touch to see if there are differences in reponse
10.01 Sensitivity of the skin to touch 11 Recognition of separate stimuli(Spatial discrimination) Different areas of skin are tested with a 'hairpin' to see if they can discriminate a double touch from a single touch
11.01 Recognition of separate stimuli 12 Sensitivity to temperatureOne finger is placed in hot water and another in cold water. Both are then placed in warm water and the sensations compared
12.01 Sensitivity to temperature 13 Location of stimuliA marble is rolled between crossed fingers to give the sensation of two marbles
13.01 Location of stimuli Transport in plants1 Uptake and evaporation in leavesThe uptake of water by single leaves is measured after coating either, neither or both surfaces with Vaseline
1.01 Uptake and evaporation in leaves 2 Uptake of water by shootsThe uptake of water by a shoot is measured, using a potometer
2.01 Uptake of water by shoots 3 Rates of transpirationThe potometer is used in different conditions to compare rates of uptake by the shoot
3.01 Rates of transpiration 4 Rate of transpiration and water uptakeBy weighing the shoot and potometer, the uptake and loss of water are compared
4.01 Rate of transpiration and water uptake 5 Uptake of water by an uprooted plantThe potometer is modified to accept a whole plant rather than a cut shoot
5.01 Uptake of water by an uprooted plant 6 Conditions affecting evaporationA simple atmometer is used to investigate the effects of different atmospheric conditions on the rate of evaporation
6.01 Conditions affecting evaporation 7 Water tension in the stemThe lower end of the potometer is placed in mercury, which is pulled up the capillary by the transpiration force
7.01 Water tension in the stem 8 Pathways for gases in a leafA leaf is immersed in hot water to expand and force out any air inside it
8.01 Pathways for gases in a leaf 9 Evaporation from the leaf surfaceEvaporation from the upper and lower leaf surface is compared and correlated with the distribution of stomata
9.01 Evaporation from the leaf surface 10 To collect and identify the product of transpirationThe shoot of a plant is enclosed in a plastic bag. The liquid which condenses is identified
10.01 To collect and identify the product of transpiration 11 To trace the path of water through a shootShoots are placed in a dye in order to investigate the route it takes through the stem and leaves
11.01 To trace the pathway of water through a shoot 12 Conducting pathways through the shootA syringe is used to force air through a shoot held under water, Air bubbles show the continuity of the vessels
12.01 Conducting pathways in the shoot 13 Measuring the transpiration rate of a potted plantTwo potted plants, one in sunlight and one in shadow are weighed at intervals
13.01 Measuring the transpiration rate of a potted plant 14 Measuring the transpiration rate of an uprooted plantTwo flasks of water are weighed at intervals. One of them contains a plant
14.01 Measuring the transpiration rate of an uprooted plant Germination and tropismsIntroduction
Introduction 1 The need for oxygenCress seeds are sown on moist cotton wool in 2 flasks one of which contains pyrogallic acid and sodium hydroxide
1.01 Need for oxygen 2 Effect of temperatureMaize fruits are germinated in moist blotting paper at different temperatures
2.01 Effect of temperature 3 The need for waterSeeds are left in moist, dry and waterlogged conditions for a week
3.01 Need for water 4 The role of cotyledonsRunner bean embryos attached to varying amounts of cotyledon are germinated on moist blotting paper in jars
4.01 Role of cotyledons 5 Use of food reserves in germinationColeoptiles and endosperm of cereal seedlings and grains are tested for starch and sugar
5.01 Use of food reserves 6 Geotropism in radiclesPea seedlings are pinned to a clinostat, or a stationary base, with their radicles horizontal
6.01 Geotropism in radicles 7 The region of growth and response in radiclesRadicles are marked with equidistant lines and left horizontally or vertically for two days
7.01 Region of growth and response in radicles 8 Region of detection and response to one-sided gravity in radiclesDifferent lengths of root tip are excised to see if the radicles still grow and respond to gravity
8.01 Detection of unilateral gravity 9 The effect of one-sided lighting on shootsHypocotyls of sunflower seedlings are marked and illuminated from one side
9.01 One-sided lighting on shoots 10 The effect of one-sided lighting on cress seedlingsCress seedlings, some of which are decapitated, are illuminated from the side or from above
10.01 One-sided lighting on cress 11 The region of detection and response to one-sided lighting in coleoptilesColeoptiles of wheat seedlings, some covered by foil caps, some decapitated, are illuminated from the side
11.01 Region of detection and response 12 Effect of indoleacetic acid on coleoptilesIndoleacetic acid in lanolin is applied to intact coleoptiles. A control is conducted with plain lanolin
12.01 Effect of IAA on coleoptiles 13 The effect of indoleacetic acid on wheat coleoptilesThe tips of the coleoptiles of wheat seedlings are removed and IAA in lanolin applied. Controls are conducted with plain lanolin, untreated cut coleoptiles and intact coleoptiles
13.01 IAA on wheat coleoptiles 14 Effect of indoleacetic acid on maize coleoptilesIndoleacetic acid in lanolin is applied to one side of a maize coleoptile. A control with plain lanolin is included
14.01 IAA on maize coleoptiles 15 The effect of light on shootsPea seedlings are grown for a week in light or darkness and their shoots compared
15.01 Effect of light on shoots 16 Respiratory activity in maize seedlingsMaize grains and seedlings are immersed in tetrazolium chloride solution for 30 minutes
16.01 Respiratory activity in maize SoilThese experiments are available as a PDF booklet which can be opened or downloaded here: Soil Experiments The experiments included are as follows: 1 To find the percentage of water in a sample of soil. 100g soil is oven-dried or air-dried and the loss of weight found. 2 To find the percentage of organic matter in a sample of soil. 50g dry soil is strongly heated by a Bunsen burner to ignite the organic matter. The loss in weight is measured. 3 To find the percentage of air In a sample of soil. Air from a can of soil is dislodged under water. The fall in water level is measured with a measuring cylinder. 4 A comparison of the permeability to water of different samples of subsoil. Water is poured through equal volumes of sand, clay mixtures in funnels and the volume passing through in a given time is measured. 5 The permeability of topsoil to water. The volume of water passing through equal depths of topsoil of varying grades is measured. Crumb structure is shown to be important. 6 Capillary attraction and particle size. Water is allowed to rise up columns of sand of different particle size and the height is measured. 7 Retention of water. Water is poured through equal volumes of peat and sand. The proportion retained is found by weighing. 8 The effect of lime on clay. Slaked lime is added to a clay suspension. 9 The pH test on soil. Acidity or alkalinity of soil samples is compared, using BDH soil indicator. 10 Micro-organisms in the soil. Fresh and sterilized soil is scattered on to a nutrient agar in Petri dishes. Colonies of bacteria and fungi appear in a few days. 11 Nitrifying bacteria in the soil. Nitrates are washed out of a soil sample and are shown to reappear after a few days, using diphenylamine sulphate as a nitrate indicator. 12 The mineral composition of the soil. Soil is shaken with water and the particles allowed to settle. 13 Estimation of the mineral composition of the soil. Soil is shaken with a clay-dispersing solution. The coarse sand and fine sand are allowed to settle and are dried and weighed. 14 Small animals in the soil. A simple Tullgren funnel is used to drive arthropods from the soil. These are then examined and counted under the microscope. Download: Soil ExperimentsBack to top |
© Copyright D G Mackean & Ian Mackean. All rights reserved.
